Summary
- Question
- Where should the remaining HUTB licences be concentrated before November 2028?
- Result
- After correcting the metric, the total barely changes ($244.0M vs $241.5M), but the ranking of neighbourhoods does (rank correlation 0.31).
- Tools and sources
- SQL · Looker Studio · Inside Airbnb
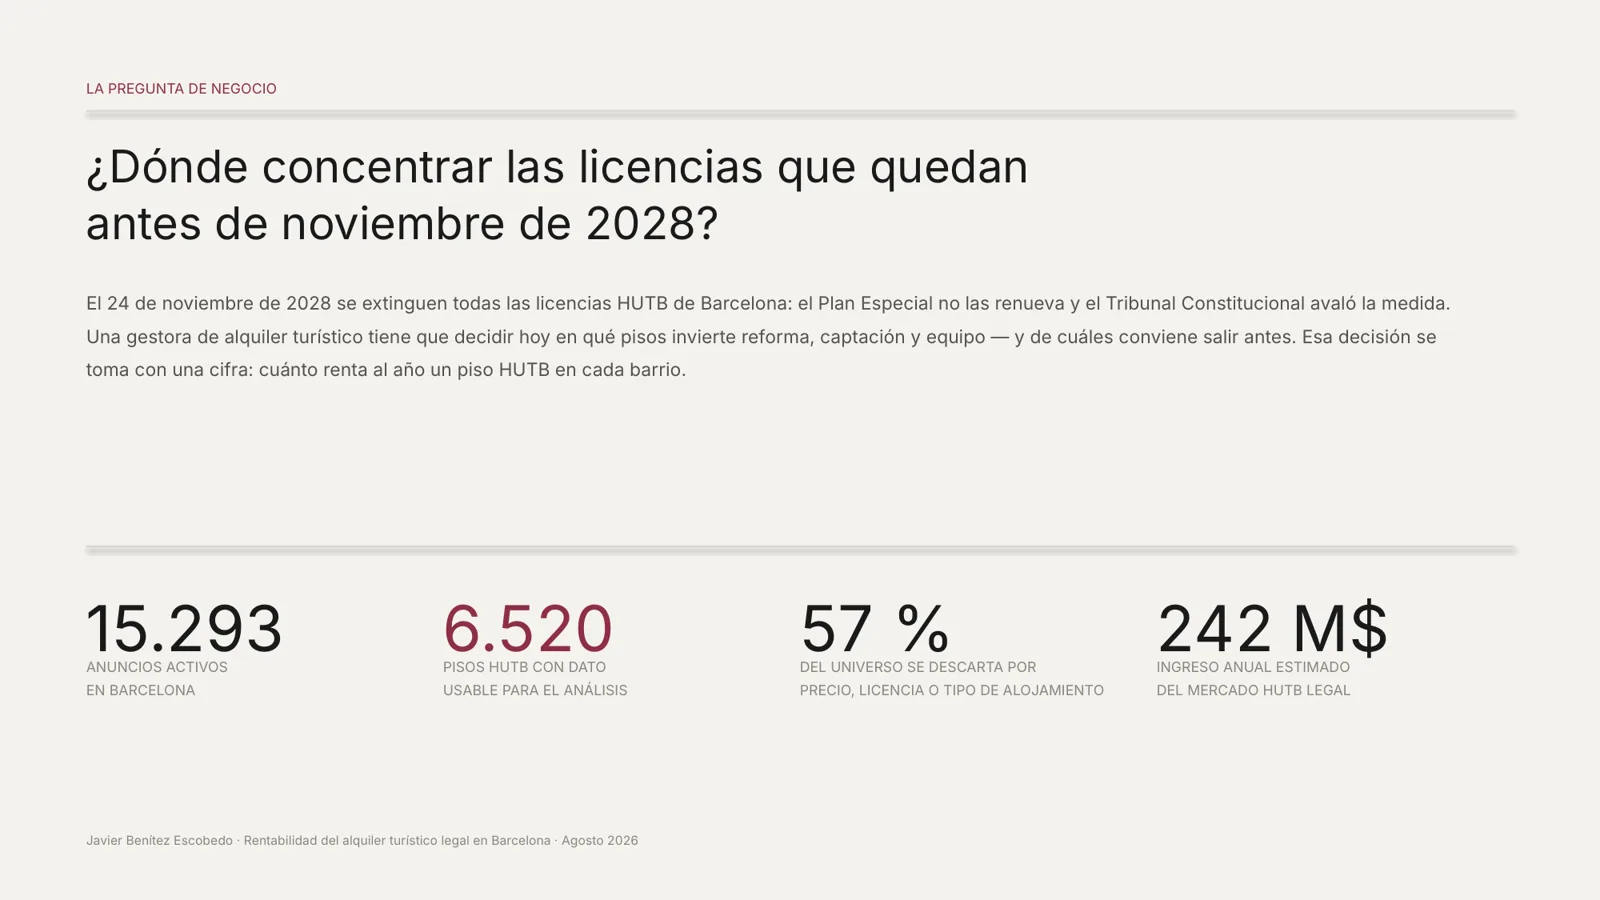
15,293
active listings in Barcelona
6,520
HUTB flats with usable data
57%
of the universe excluded for price, licence or type of accommodation
$242M
estimated annual revenue of the legal HUTB market
The business question
Where should the remaining licences be concentrated before November 2028?
On 24 November 2028 every HUTB licence in Barcelona expires: the city's Special Plan does not renew them and Spain's Constitutional Court upheld the measure.
Who it is for: a holiday rental management company that has to decide today which flats to invest refurbishment, acquisition and staff in, and which to exit first.
The market today
Fewer than half of the listings with a price have an HUTB licence.
Of 13,355 listings with a price, only 48.7% have an HUTB licence (7,195 listings, the ones that disappear in 2028). 25.4% are already seasonal rentals, a category that 2028 does not affect. 19.9% do not declare any information (not necessarily irregular).
The metric and its adjustment
Estimated annual revenue per flat.
Dataset formulaprice per night × (365 − available nights)
What it signals
The ceiling of gross revenue if every blocked night were a night sold.
What it is not
It is not profit (it does not deduct management, cleaning, commissions or taxes), nor actual occupancy.
Real case · a penthouse in Sarrià: $451 a night, 31 available nights, 0 reviews in 12 months, last review in April 2024 → $150,634 a year according to the formula. That one flat, on its own, made Sarrià look like the most profitable neighbourhood.
The adjustment · distrust the calendar
The calendar is replaced by occupancy estimated from the pace of reviews.
395 HUTB flats (6.0%) have their calendar closed for more than 200 nights and almost no reviews; 129 have none in 12 months. They contribute $29.5M a year with the dataset formula (12.1% of the market) and $1.3M with the review model.
Correlation between the two estimates of occupied nights: 0.15. In total they almost match ($244.0M vs $241.5M, 1%), but neighbourhood by neighbourhood they do not: rank correlation 0.31.
The funnel
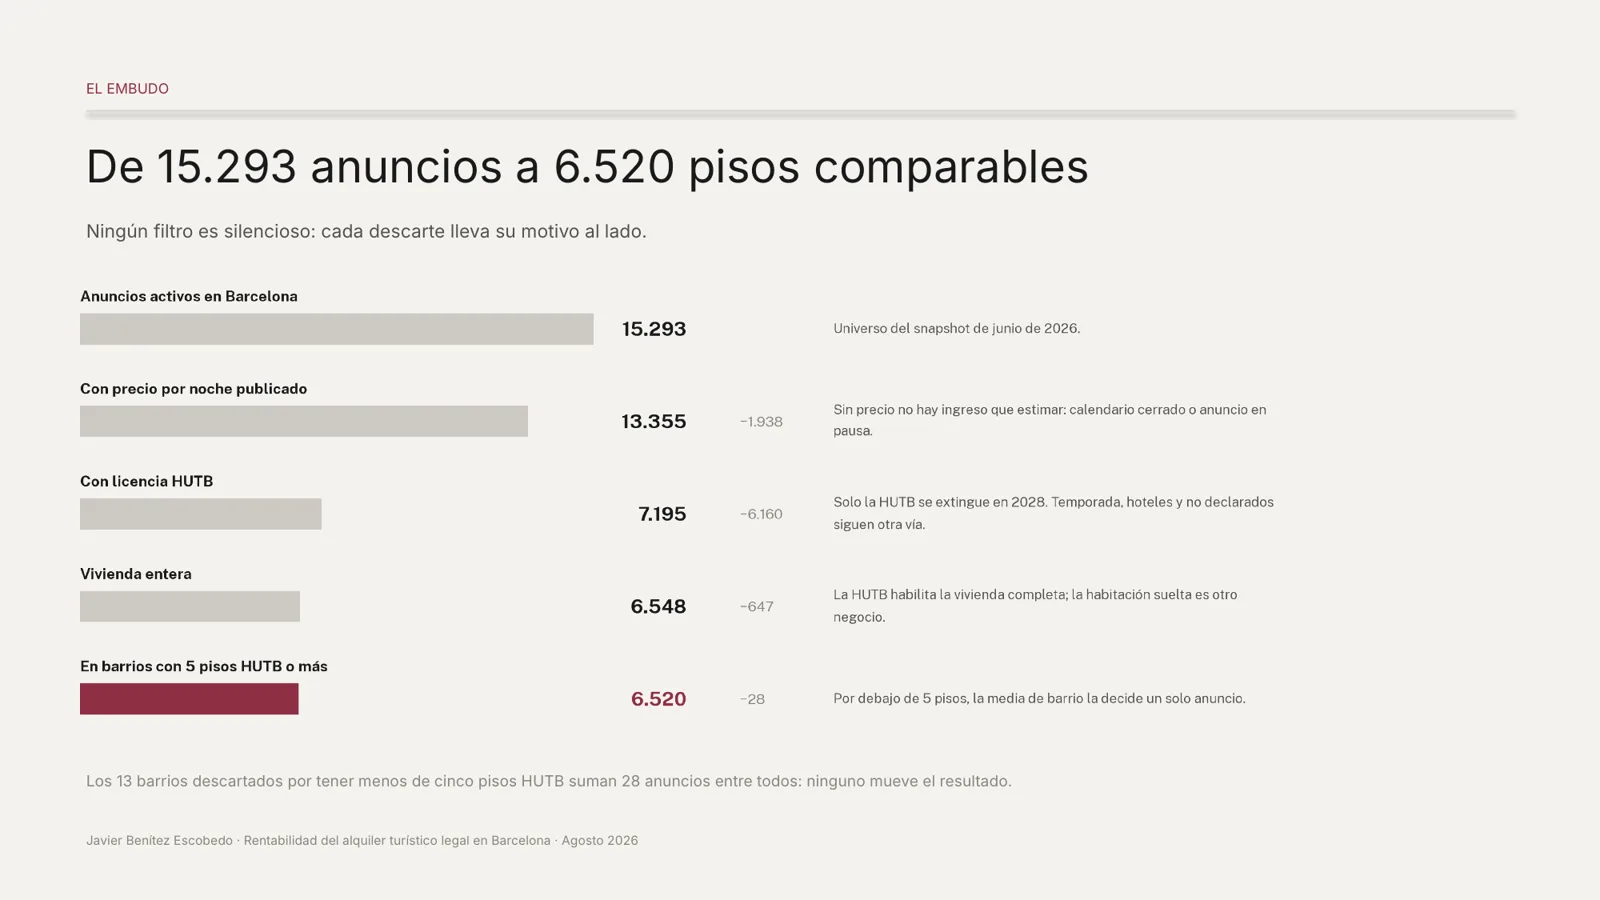
From 15,293 listings to 6,520 comparable flats.
- Active listings in BarcelonaJune 2026 snapshot
- With a published price per night−1,938
- With an HUTB licence−6,160
- Entire home−647
- In neighbourhoods with 5 or more HUTB flats−28 (13 neighbourhoods)
The 13 excluded neighbourhoods add up to 28 listings.
Findings
Three groups, three mechanisms.
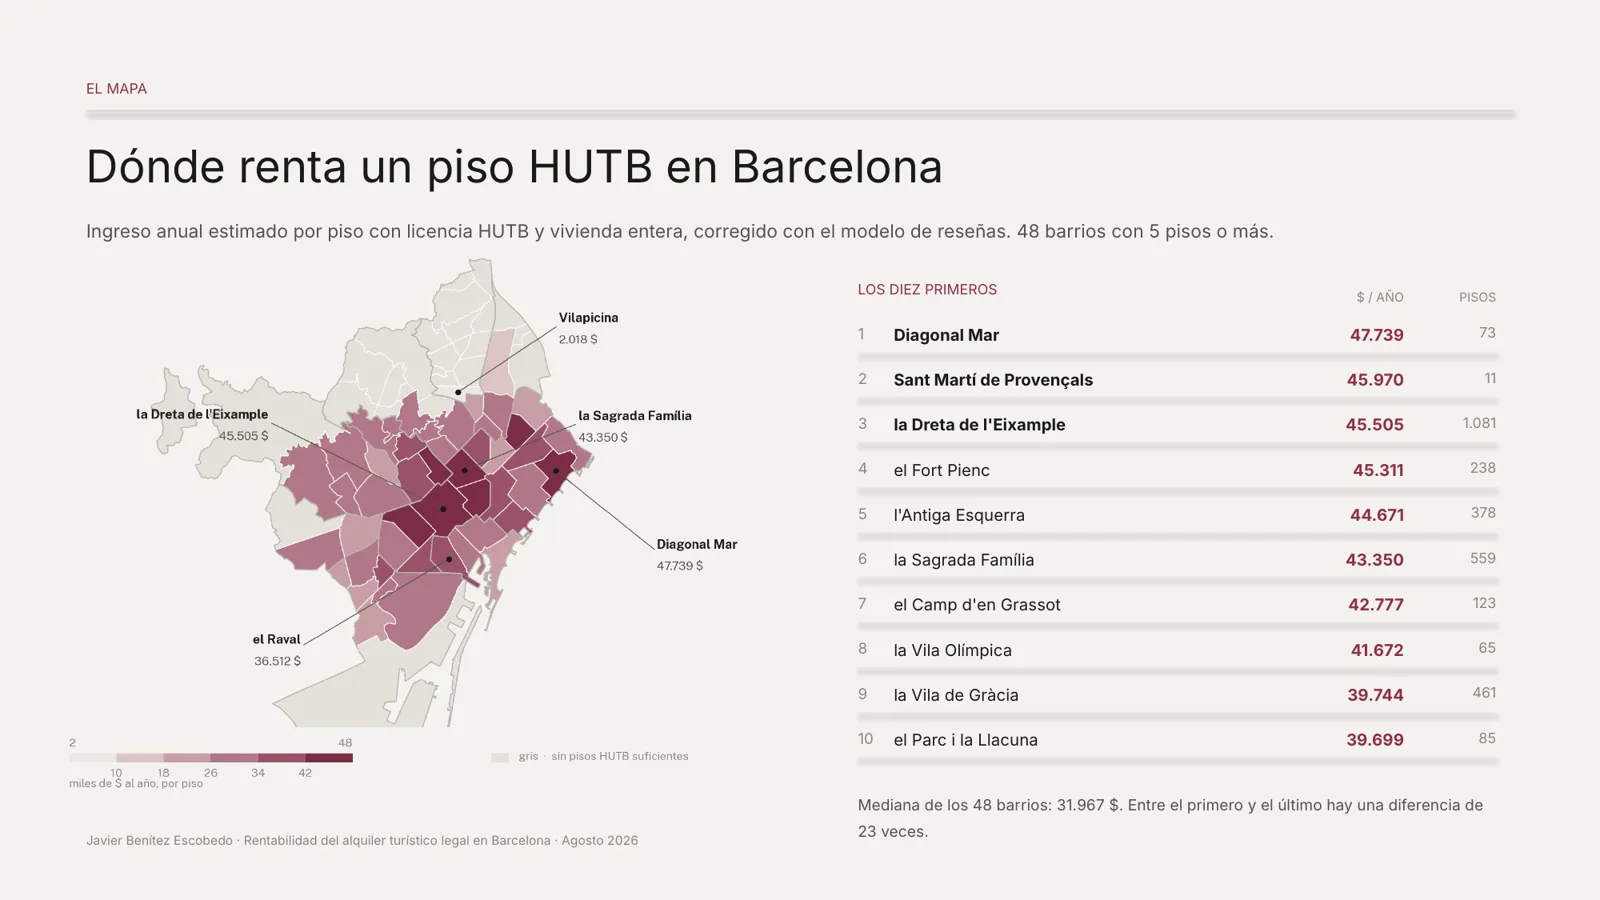
| # | Neighbourhood | Revenue per flat ($) | Flats |
|---|---|---|---|
| 1 | Diagonal Mar | 47,739 | 73 |
| 2 | Sant Martí de Provençals | 45,970 | 11 |
| 3 | la Dreta de l'Eixample | 45,505 | 1,081 |
| 4 | el Fort Pienc | 45,311 | 238 |
| 5 | l'Antiga Esquerra | 44,671 | 378 |
| 6 | la Sagrada Família | 43,350 | 559 |
| 7 | el Camp d'en Grassot | 42,777 | 123 |
| 8 | la Vila Olímpica | 41,672 | 65 |
| 9 | la Vila de Gràcia | 39,744 | 461 |
| 10 | el Parc i la Llacuna | 39,699 | 85 |
Median of the 48 neighbourhoods: $31,967. Between the first and the last, a 23-fold difference.
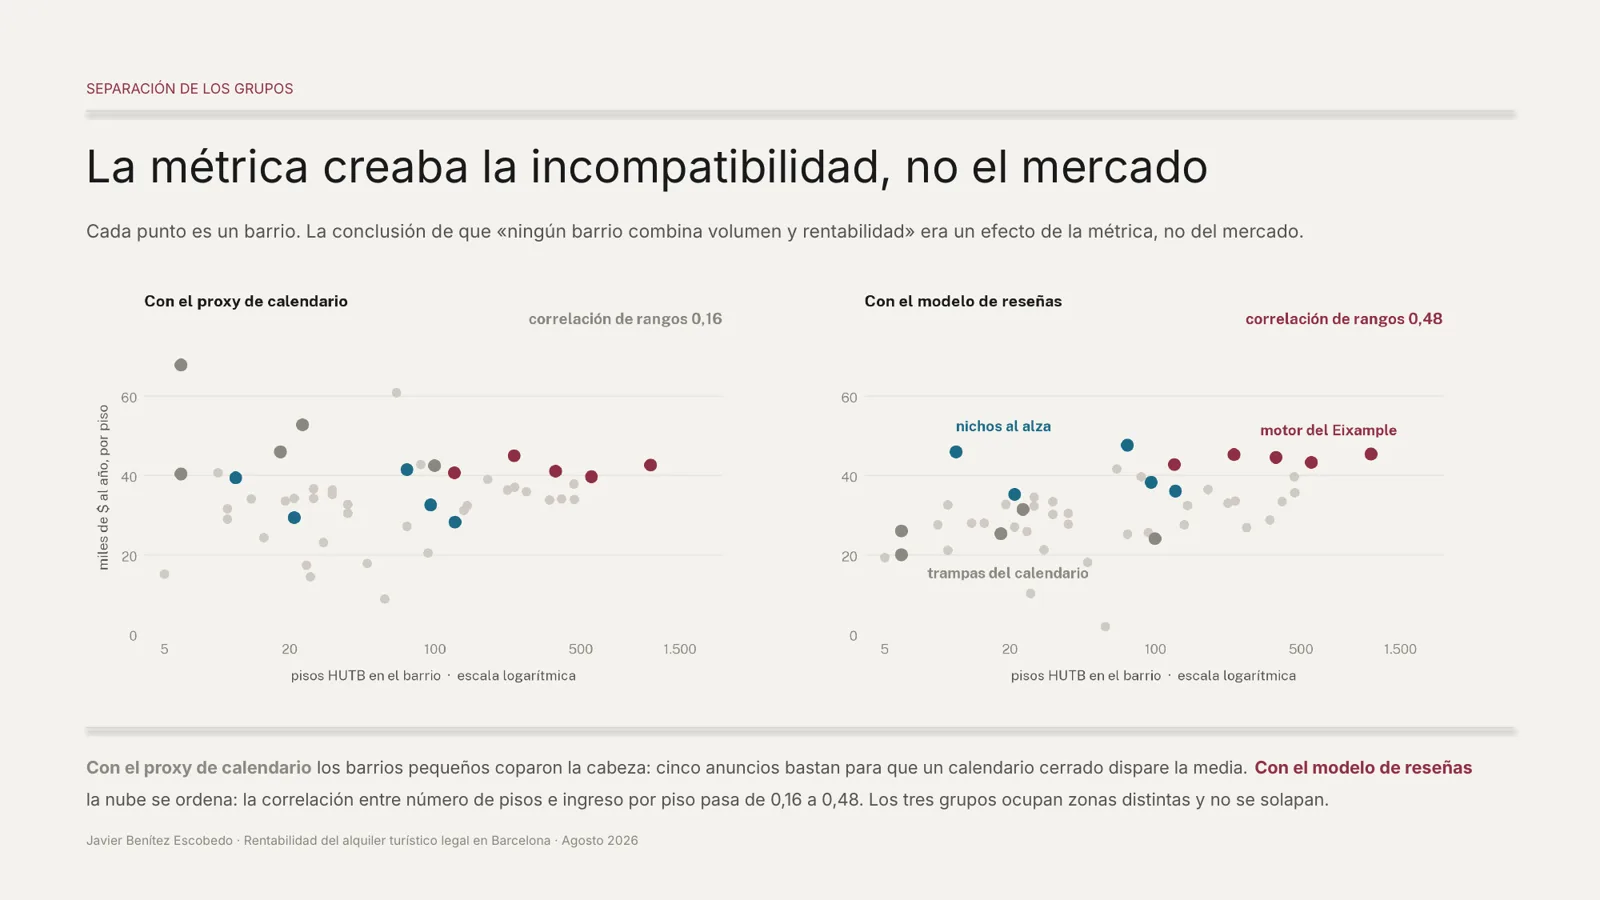
Eixample engine · confirmed by both metrics
5 adjacent neighbourhoods, 2,379 HUTB flats and an average of $44,700 a year per flat.
Dreta de l'Eixample, Fort Pienc, Antiga Esquerra, Sagrada Família and Camp d'en Grassot. None falls below $42,700.
Rising niches
Neighbourhoods the dataset undervalued: they climb between 8 and 26 places after the correction.
Diagonal Mar, Sant Martí de Provençals, Hostafrancs, el Camp de l'Arpa and la Salut. Diagonal Mar, with 73 flats, is the most solid and ranks first in the city.
Calendar traps
The ones that fall most after the correction.
El Besòs i el Maresme, Sarrià, el Clot, les Corts and la Verneda. Sarrià drops from $67,870 to $26,100 per flat; without the penthouse, $51,317.
Triangulation
A private host with a single flat earns more per unit than a large portfolio.
A private host with one flat earns $47,021 a year; a portfolio of more than 20 flats, $31,077 (34% less per unit). The nightly price is flat ($285–298); what falls is occupancy, reviews and the superhost badge (from 55% to 15%).
By district
Eixample holds 3,073 of the 6,520 flats (47%) and the highest revenue per flat ($41,600). Ciutat Vella earns less than assumed ($31,116). Les Corts is where the calendar deviates most ($41,073 vs $26,460).
Limitations
What this analysis does not answer.
- It is gross revenue, not profit.
- The review model caps occupancy at 70% of the year: it underestimates the best performers.
- It is a snapshot from June 2026, not a time series.
- Averages for small neighbourhoods remain fragile (Sarrià and la Verneda: 6 flats).
- It is market intelligence: it does not replace a portfolio's internal data.
How to use it
Three decisions, each with its stopping rule.
- Focus retention on the Eixample corridor (2,379 flats).if the block's revenue per flat falls below $40,000 in the next snapshot, revisit the thesis.
- Test the niches before prices rise (Diagonal Mar, el Camp de l'Arpa).do not commit capital in neighbourhoods with fewer than 50 flats without confirming with your own data.
- Drop the neighbourhoods that only looked profitable from the plan.bring them back only if your own booking history contradicts the review signal.
Conclusion
The map of the business changes when you change how you measure it.
The $242M of the legal HUTB market is the same with either metric; what changes is which neighbourhood it is attributed to.
Why it is reliable: two estimates with different sources of error match in aggregate, and the disagreements fall where they were expected: in neighbourhoods with few flats.